Plant Production Report
Overview
The Plant Production Report provides an overview of your washer costs along with your production totals. Comparing your Actual and Standard CWT reveals significant differences in the actual versus standard load weights.
Example Reports
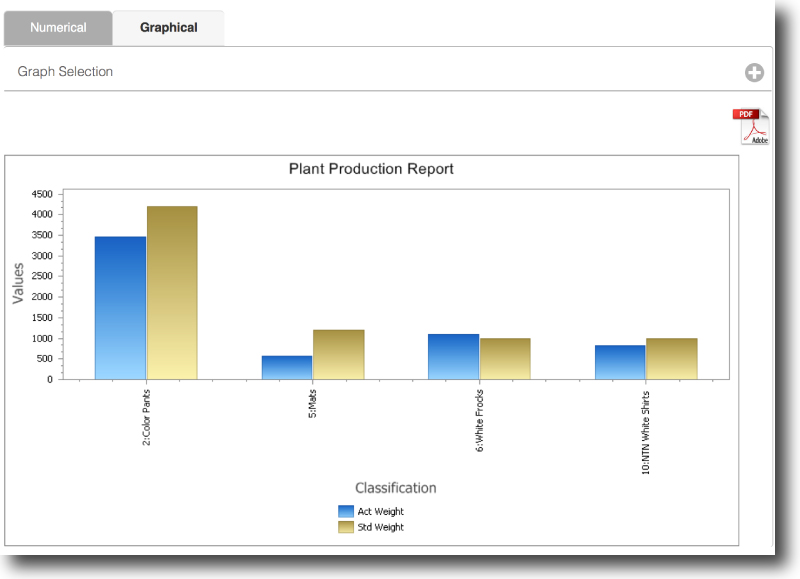
Graphical tab
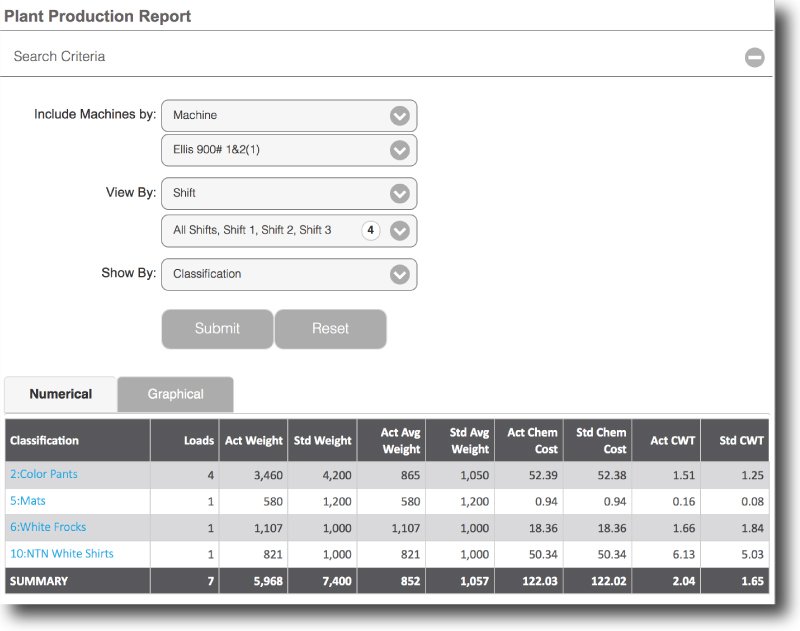
Numerical tab with criteria
Glossary
Report Criteria
Plant
Selecting "Plant" from the "Include Machines By" drop-down indicates that the resulting dataset includes information from all of the wash aisle machines.
Group
When adding the machines to your system, you designated machine groups such as "Tunnel Washers" or "Ellis 900." You can filter your data on any group or collection of groups.
Machine
The selection of "Machine" enables you to select one or more machines regardless of their group.
Classification
When you select Classification in the "Show By" dropdown, you get your data grouped by the previously designated product grouping or classification (e.g., mats, shop towels, bar towels).
Result Set
Your data is displayed either in a chart (graphical) or a table (numerical) format.
Loads
The number of loads completed for that classification or formula.
Act Weight (Actual Weight)
The weight of the load based on weights received from the rail or sling system.
Act Avg Weight (Actual Average Weight)
The average weight based on real values received from the rail or sling system.
Std Weight (Standard Weight)
The combined weights based on the standard load weights for the various machines.
Std Avg Weight (Standard Average Weight)
The average weight based on the standard weights for the various machines.
Act Chem Cost (Actual Chemical Cost)
The amount spent on chemicals to produce the clean product based on values from the washer or chemical systems.
Std Chem Cost (Standard Chemical Cost)
The cost for chemicals based on a predetermined value.
Act CWT (Actual Cost per Hundredweight)
The cost to produce 100 pounds of finished product.
Std CWT (Standard Cost Per Hundredweight)
The cost to produce 100 pounds of finished product based on a predetermined standard.