Quick Graph
Overview
Quick Graph provides you convenient access to charts for a single production indicator. You can generate graphs for:
- Chemical cost,
- Credited loads and weights,
- Cost per CWT,
- Non-credited chemical cost,
- Non-credited loads, and
- Non-credited weights.
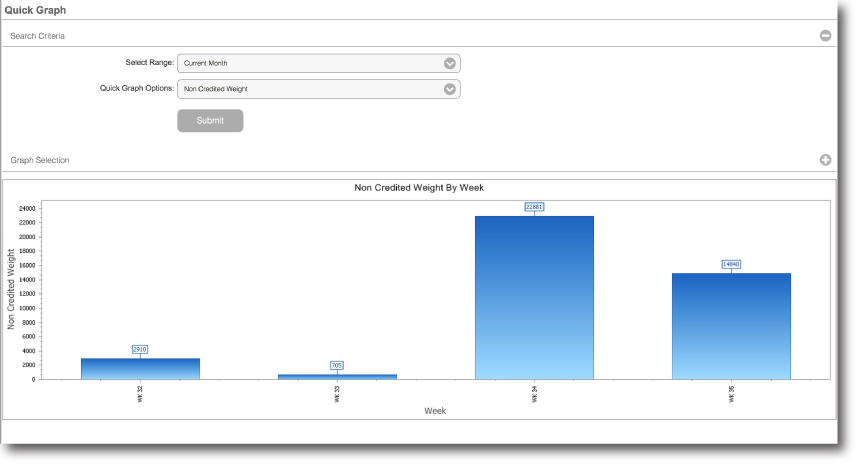
Example Report
Glossary
Criteria
Select Range
Select either a predetermined range or select "Other" to enter your own range.
Quick Graph Options
Select the production data you wish to graph.
Graphed Results
Chemical Cost
Get a breakdown of chemical cost per day.
Credited Loads
Your number of credited loads.
Credited Weight
The credited total weight for each day.
CWT (Cost per hundredweight)
The average daily cost per hundredweight.
Non-credited Chemical Costs
The total daily cost for non-credited chemicals.
Non-credited Loads
The number of loads not credited to the day's production.
Non-credited Weights
The total weight of non-credited product for the each day.