Wash Aisle Graph
Overview
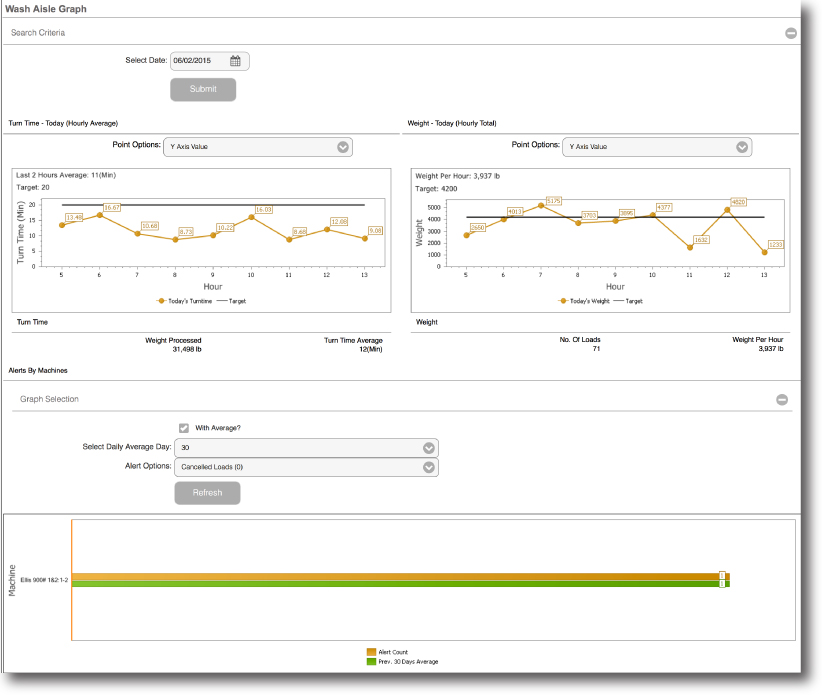
The Wash Aisle Graph provides a graphical representation of your turn times and weights for each hour of the selected day. The report allows you to identify peaks and lulls in performance in comparison to your target goals. The bottom graph gives either the number of alerts, credited loads, or non-credits loads for each machine.
Example Report

Glossary
Graphed Results
Turn Times
The average time that passes between formula end and formula begin for each hour.
Weight
The processed pounds for that hour.
Machine graps
Using the graph you can quickly graph the watchdog alerts, cancelled loads, or Non-credited loads. By checking the "With Average" checkbox, and selecting a number of days, you can get your graphed results as compared to the averages for past number of days you selected.