Washer Average Performance Comparison Report
Overview
The Washer Average Performance Comparison contrasts the key performance indicators for two different time frames. The compared values include:
- Weights,
- Formula run times,
- Load times,
- Turn times, and
- Unload times.
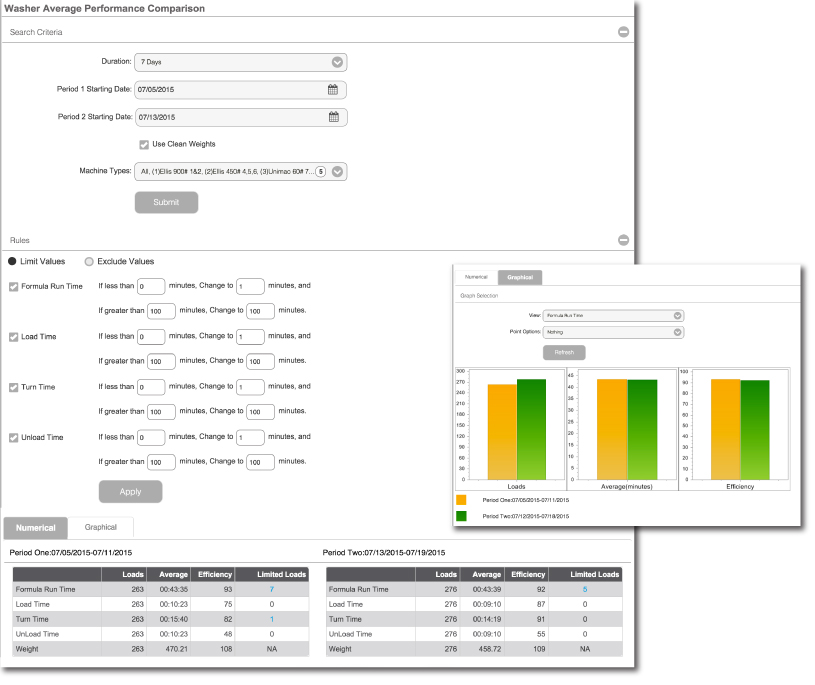
Example Report
The Washer Average Performance Comparison Report showing criteria, rules, and returned data in a numeric and graphical form.
Glossary
Report Criteria
Duration:
Choose a duration of one day up to one year. Choose "Other" to input a number of your choice.
Period 1 and 2 Starting dates:
Use the calendar controls to choose your starting date for each period. Avoid starting dates that cause the two periods to overlap.
Use Clean Weights
Select this option to use the product clean weights over the soil weight.
Machine Types
Limit your returned data to selected machine types (default "All").
Rules
Outliers, or data outside the acceptable range, can have a huge impact on your final numbers. To prevent these outliers from influencing your report data, you can use the Rules section to either exclude or limit these values. If you choose to not limit or exclude values, select an option and uncheck the four options.
Limit Values:
When you select the Limit Values option, you can limit values that exceed or fall short of the expected values for Formula Run Time, Load Time, Turn Time, and Unload Times. Limiting values allows you to include the data without adversely affecting your totals.
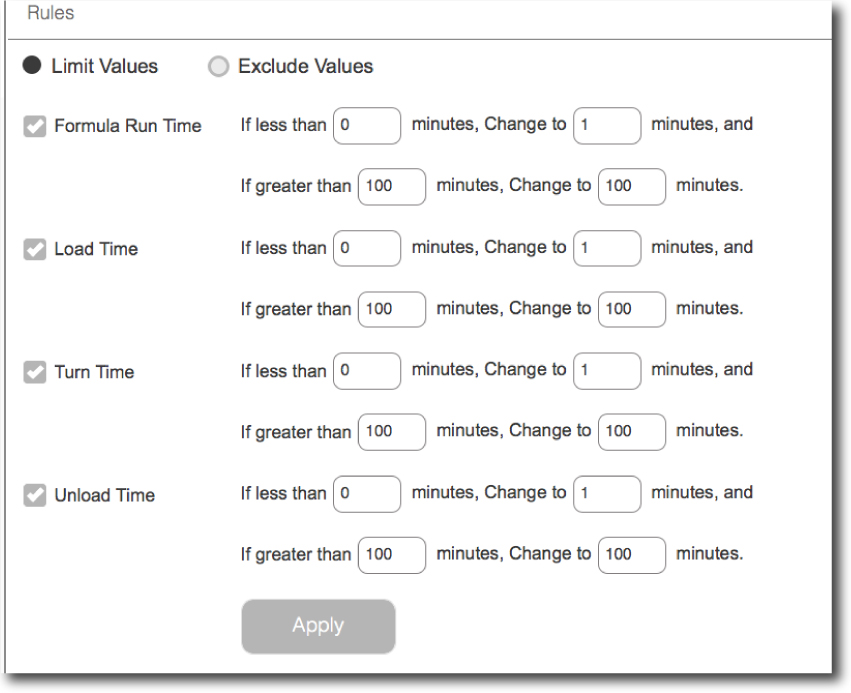
Exclude Values:
When you select the Exclude Values option, you can exclude those values that exceed or fall short of the expected values for Formula Run Time, Load Time, Turn Time, and Unload Times. Excluding values keeps outliers from affecting your totals, but those weights do not appear in your report.

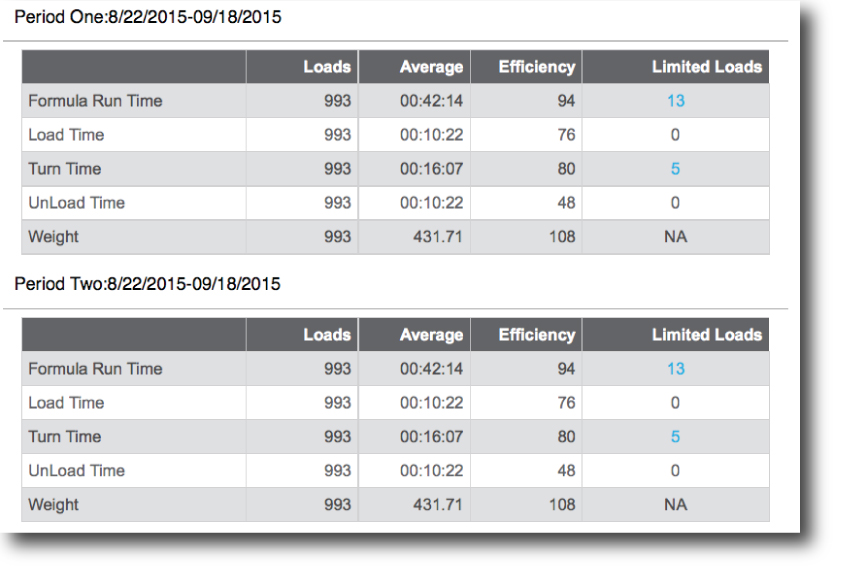
Result Set: Numerical
The resulting tables contain five rows each. The table on the left contains values for Period One, and the table on the right contains values for Period Two. Each table contains values for The Formula Run Time, Load Time, Turn Time, Unload Time, Weight.
Loads
The number of loads completed for the period.
Average
The average time in hours: minutes: seconds.
Efficiency
The efficiency in percentage form as compared to the standard.
Limited or Excluded Loads
The last column of data represents the number of limited or excluded loads. For values above zero, the number serves as a link to the Summary Load Report where you can get detailed information on the limited or excluded loads.
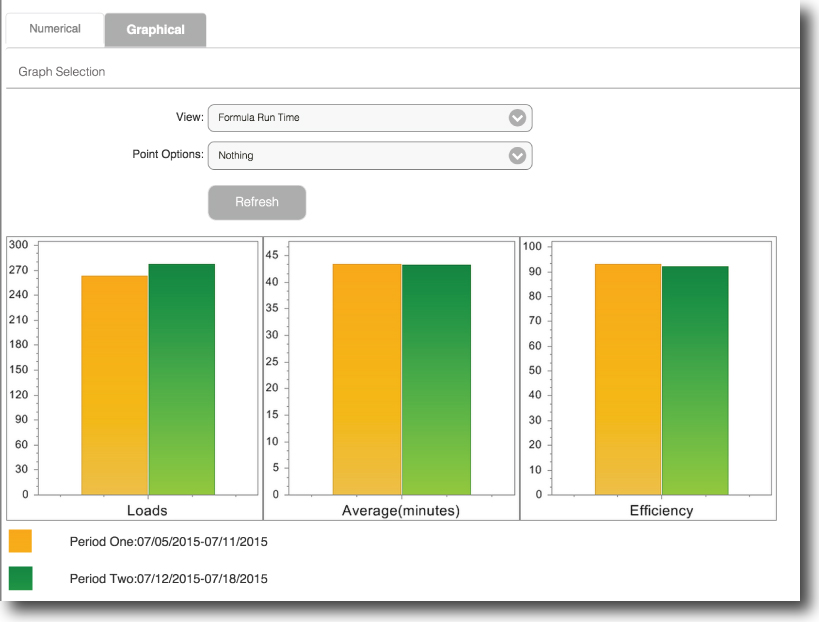
Result Set: Graphical
Your time and rules selections results in five sets of three graphs. These bar graphs give you a side-by-side comparison of the two duration's loads, average time (in minutes) and efficiency percentage. To choose one of the five key indicators use the View drop-down in the Graph Selection.